The Charter KPIs That Show What the Season Is Really Doing
Discover key KPIs for fishing charters to optimize growth, marketing, and customer satisfaction.
Fishing Charters, Fishing Charter KPIs, Charter Marketing
The Charter KPIs That Show What the Season Is Really Doing
What KPIs should fishing charter operators track each season? If you want to grow instead of just stay busy, you need a clear answer to that question. The truth is simple. Top operators treat each season like a report card. They look beyond total revenue and ask whether the boat is being used enough, if marketing is working, and if guests are happy enough to come back and send friends. In this guide, we will break down the core fishing charter KPIs that actually show what is happening in your business so you can make better decisions on pricing, marketing, crew, and schedule before the season slips away.
Why Revenue Alone Does Not Tell You Enough
Revenue feels like the score of the season. You finish a month, look at the deposits, and decide if it was good or bad. The problem is that revenue hides what actually changed. You can have a “record” month because fuel prices spiked, because you raised prices too high and lost volume, or because a one-off corporate trip distorted the numbers. None of that tells you if your charter is healthier than last year.
Growth-minded operators want to know if they are filling the calendar, converting more website visitors, and building a base of repeat guests who leave strong reviews. Industry trends show digital, direct booking growth and higher customer expectations for professionalism and communication. If you only track revenue, you miss whether your operation is keeping up. The right fishing charter KPIs separate luck from progress so you can repeat what works and fix what does not before the next season hits.
The Seven KPIs That Matter
These seven fishing charter KPIs give you a clear, seasonal picture. Track them month by month and year over year.
Total Trips Run
This is the count of trips that actually left the dock. It tells you how well you used your inventory of dates and time slots. A higher trip count at the same price means more revenue and better crew utilization. It also shows demand trends across weekdays, weekends, and shoulder seasons. If the calendar looks full but trip count is flat, you may be moving bookings around rather than growing overall demand.Revenue Per Trip
Divide total trip revenue by trips run. This shows the value of each trip, including add-ons and upsells. It reflects pricing, party size, and how well you package experiences. When fuel and maintenance costs rise, revenue per trip needs to move with them. If trip count is up but revenue per trip is sliding, you are working harder for the same or less money and may need to adjust pricing or minimum headcount.Booking Conversion Rate
This is the percentage of leads or site visitors who actually book. You can measure it as bookings divided by inquiries, or online bookings divided by unique website visitors. With digital, mobile-first booking now standard, this KPI shows if your website, listing pages, and booking flow are doing their job. A low conversion rate often points to confusing pricing, too many steps, or slow responses to messages rather than lack of demand.No-Show Rate
This is the percentage of booked trips where guests do not show or cancel too late to rebook. High no-show rates kill profit and crew morale. In 2026, deposits and clear cancellation policies are standard. If your no-show rate is high, you likely need stronger deposit rules, better automated reminders, and clearer communication about meeting times, weather expectations, and what is included.Repeat Guest Rate
Measure the percentage of guests this season who have fished with you before. Repeat guests are cheaper to acquire, easier to serve, and more likely to bring friends or family. A strong repeat rate means your experience and follow-up are working. If it is low, you may need better post-trip communication, basic CRM habits, and a simple schedule for inviting past guests to rebook during prime dates.Average Review Score
Your average rating on Google, TripAdvisor, and other sites is a public KPI that shapes demand. Many guests will not even inquire if your rating is low or outdated. Average score plus review volume shows how consistent your service is and how well you ask for feedback. In a market where customers expect professional, digital experiences, strong reviews are proof that you deliver on that promise from first message to final photo.Cost Per New Booking
Take your total marketing spend for a period and divide by the number of new bookings it generated. Include ad spend, listing fees, and any marketing retainers. This KPI tells you if your marketing is profitable and which channels deserve more budget. As direct, mobile bookings grow, operators who know their cost per booking can confidently scale what works and cut what does not, instead of guessing based on “busy” days.
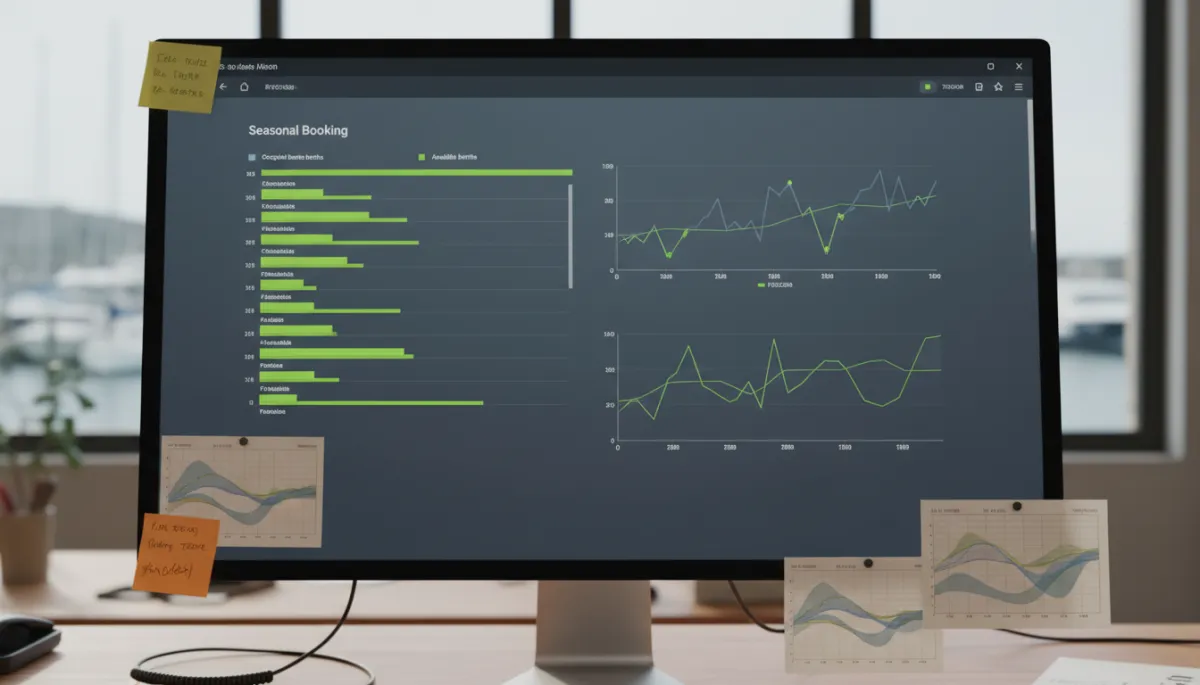
Seasonal booking charts reveal if demand is really growing or just shifting.
How to Track These Without a Spreadsheet
You do not need to live in Excel to track these fishing charter KPIs. Modern booking and CRM tools for charters already collect most of the data in the background. Every time a guest books online, signs a digital waiver, pays a deposit, or leaves a review, that information can feed simple reports. The key is to pick software that gives you clear dashboards instead of raw exports you have to wrestle with after a long day on the water.
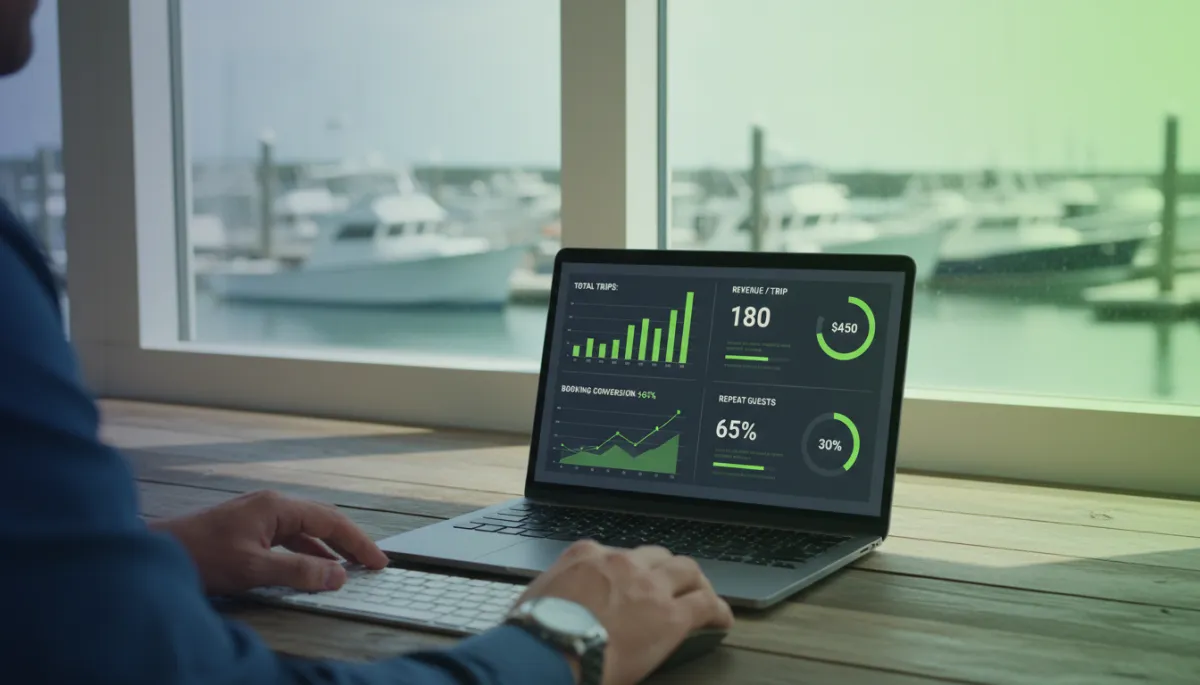
Look for systems that show trips run, revenue per trip, and basic marketing metrics on one screen. Many charter-focused CRMs also flag repeat guests automatically and track no-show or cancellation patterns. You should be able to open your phone at the dock, glance at a few charts, and know if this month is ahead or behind last year. If your current setup cannot do that, the problem is not your math. It is your tools.
What to Do When a KPI Drops
When a KPI dips, treat it like a bite pattern change, not a personal failure. First, confirm it is real by comparing the same month or week to last year and checking for one-off events like storms or closures. Then pick one KPI to fix at a time. If booking conversion is down, review your website, photos, pricing clarity, and response time. If no-show rate jumps, tighten deposits and add automated reminders the day before and the morning of the trip.
For repeat guest rate or review score drops, focus on the experience and follow-up. Small changes like clearer expectations, better onboard hospitality, and a simple post-trip message asking for feedback can move the needle. The goal is not to obsess over every blip. It is to notice real shifts early, test a fix, and watch the KPI for the next few weeks to see if it recovers.
How VrixPlay Surfaces These Numbers
VrixPlay is built for charter operators who want clear numbers without paying heavy software fees. It is a free platform with a flat 3% per booking and no monthly subscription. As bookings flow through VrixPlay, the platform pulls together your trip counts, revenue per trip, and key guest data so you can see how the season is trending at a glance. You are not stuck copying numbers from emails into a spreadsheet after dark.
Instead, you get simple, operator-first reporting that highlights the KPIs that matter: utilization, booking sources, repeat guests, and more. That lets you spend less time chasing data and more time fixing what needs work. See your charter data in one place and use it to make faster, cleaner decisions about pricing, marketing, and schedule.
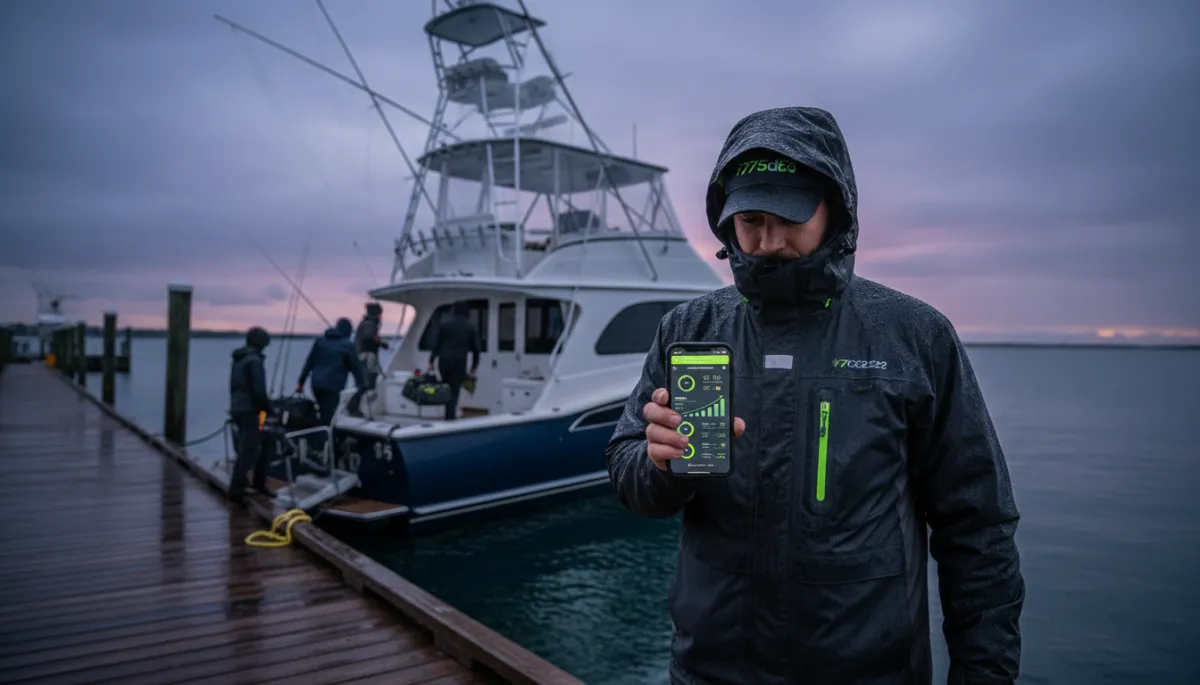
Captains who watch a few key KPIs can adjust faster than competitors.
FAQ: Fishing Charter KPIs
How often should I review my fishing charter KPIs?
At minimum, review them monthly during the season and once per quarter in the off-season. Many operators do a quick weekly check of trips run, revenue per trip, and upcoming calendar to stay ahead of soft spots. The key is consistency. Short, regular check-ins beat a huge data dive once a year when it is too late to adjust pricing or marketing for that season.
Which fishing charter KPI should I fix first?
Start with the KPI that is both weak and closest to money. For most operators, that is booking conversion rate or revenue per trip. Improving conversion turns existing demand into more trips. Raising revenue per trip through pricing, add-ons, or minimum headcount puts more profit on each outing. Once those are solid, focus on repeat guest rate and average review score to build long-term demand.
Do small, single-boat charters really need KPIs?
Yes. Single-boat captains feel every slow week and every fuel price jump. That makes simple KPIs even more important. You do not need a corporate dashboard, but you do need to know if this June is better than last June, if your website is pulling its weight, and if guests are coming back. A handful of KPIs gives you that insight without turning your job into paperwork.
How does VrixPlay help with repeat guests and reviews?
VrixPlay keeps your booking and guest history in one place, so you can see who has fished with you before and how often. It makes it easier to recognize repeat guests, track their bookings, and understand which channels brought them in. Combined with automated follow-up and clear review links, that structure helps you lift both repeat guest rate and average review score over time without adding more manual work.
Close
Revenue tells you what hit the bank. Fishing charter KPIs tell you why. Track trips run, revenue per trip, conversion, no-shows, repeats, reviews, and cost per new booking each season. Use those numbers to tune pricing, marketing, and guest experience. If you want those insights without spreadsheets or big software bills, VrixPlay gives you operator-first reporting at a flat 3% per booking. See your charter data in one place and run the season with intent, not guesswork.